
Questions worth measuring
- Read changes in activity across the day.
- Assess movement around ordering and collection.
- Compare seating activity and passing traffic across periods.
Understand busy periods and activity around ordering, collection and seating.
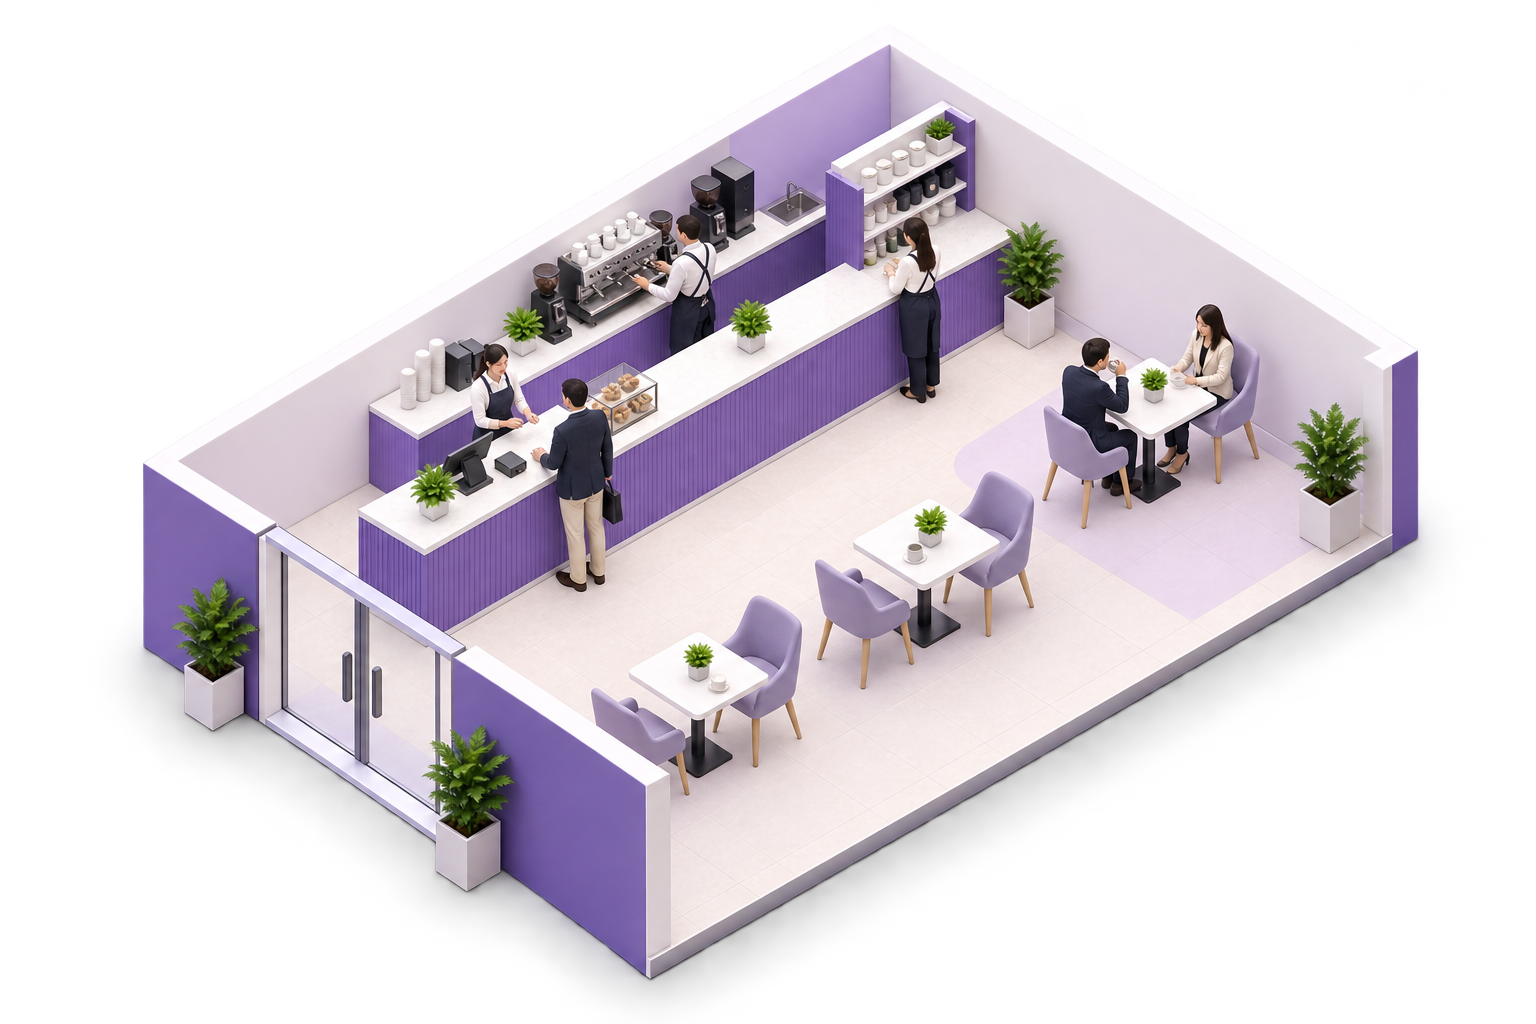
Choose an indicator to see its measurement area and explanation on the illustration.
An illustration of measurement; not live tracking or your organisation’s data.
Inward crossings at the café entrance are grouped by time. Repeat entries are not a count of unique people.Entry counts are compared across equal time intervals to identify the busiest periods. Peaks come from period data, not the people shown in this illustration.Time is measured in the defined ordering-wait zone in front of the counter. This describes visitor waiting, not coffee-preparation time or individual staff speed.Visits and presence in the observed seating zone are reviewed over time. This describes zone use; measuring each table requires suitable definitions and coverage.Review operating schedules, space allocation and seasonal comparisons. Order-preparation speed requires suitable ordering-system data or additional measurement tools.
AI tools help summarise changes in ordering, collection and seating activity across the day to support staffing schedules, space allocation and seasonal comparisons.
Review your infrastructure, required data sources and suitable analytical tools within the service scope.